Home/Intelligence/Forecasting
All solutions
Forecasting
See which acquisition sources are likely to pay back before all the revenue arrives.
Compare what customers have paid with what they are expected to spend. Review the uncertainty around each forecast, then decide where to increase, hold, or reduce acquisition spend.
Intelligence
Compare sources beyond the first purchase
A cohort is a group of customers acquired from the same source in the same period. Early revenue shows only the part of that cohort's value recorded so far. One source may earn quickly and flatten. Another may start slowly, then continue through repeat purchases or rebills.
The workbench puts sources on the same time horizon and scale. This makes the comparison useful before the final return is known, without treating two similar first-week results as the same long-term outcome.
Keep recorded and forecast return separate
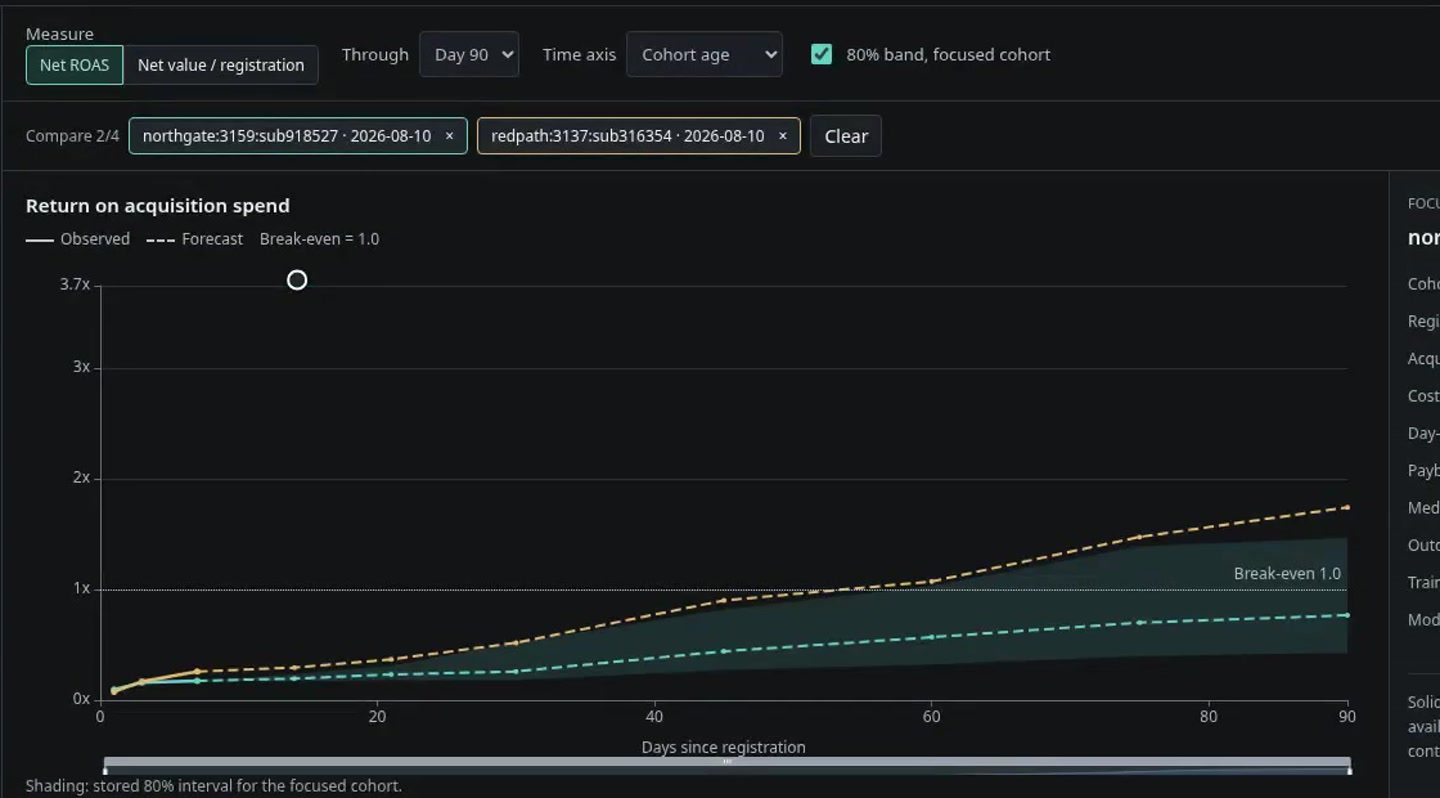
Solid lines show return already recorded. Dashed lines show the predicted path. The machine learning model estimates customer value through the selected horizon and compares it with acquisition spend. A return of 100% marks payback. As more payments arrive, the recorded line extends and the forecast updates what may remain.
Forecasts use historical customer outcomes and the activity recorded so far. The shared data model keeps them tied to the customers, payments, and sources they describe.
Use uncertainty as part of the decision
The shaded range shows plausible outcomes around the central forecast. A wide range is a reason for caution, even when the expected return looks strong. A narrower range backed by more customers can support a firmer decision.
This prevents false precision. Two sources can have the same expected payback but need different treatment because one is newer, smaller, or less stable. The team can wait for more evidence, keep a test budget limited, or inspect the cohort in more detail.
Find the sources that need attention first
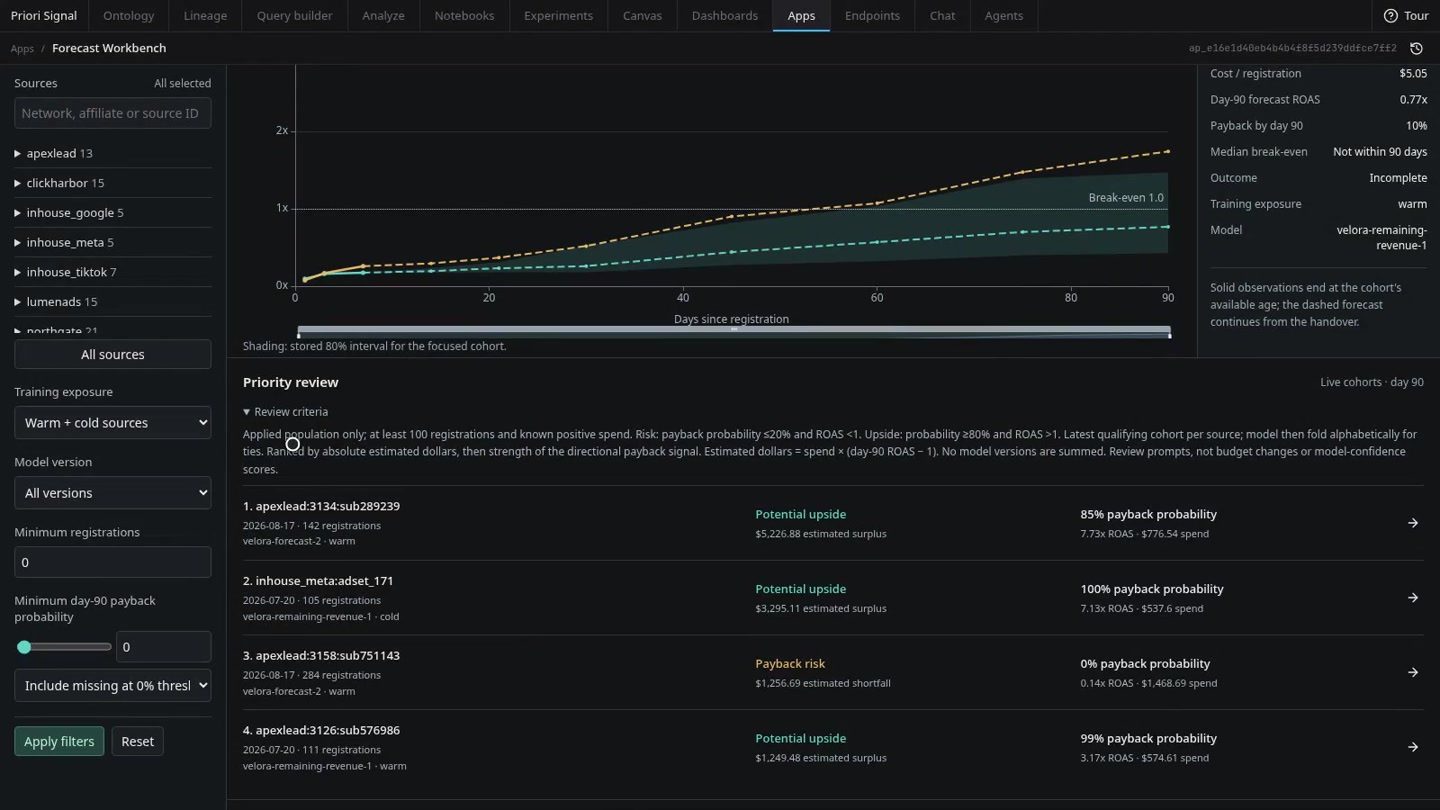
The priorities list highlights sources with a strong forecast of good returns or a likely loss. It considers both confidence in the forecast and the amount of money involved. Review the strongest opportunities and the most costly risks first.
Each entry opens the source's recorded return, forecast, and uncertainty. Review the evidence, then decide whether to increase spending, limit exposure, or wait for more customer activity.
Make the spending decision earlier
The practical benefit is a shorter delay between seeing early customer behaviour and deciding what to do with spend. A growth review can work more like a trading desk: compare sources on the same basis, size the possible upside and downside, and give attention to the decisions that matter most.
The manager still decides whether to increase, hold, or reduce spend. For a wider budget question, use scenario planning to compare proposed allocations. To pass an earlier value signal into acquisition systems, see value-based acquisition.
- Compare sources fairly. Use the same horizon while preserving different revenue curves.
- See what is known. Recorded return, predicted return, and uncertainty remain visibly distinct.
- Focus the review. Confidence and financial exposure help decide where attention is worth spending first.