Define how records connect
A plausible join can still produce the wrong answer. Join one customer to several payments at the wrong level and the customer row is duplicated. Sum revenue after another one-to-many join and the same payment can be counted more than once. An inner join can also remove customers who never paid.
The shared model records which fields connect, the direction of the relationship, and the level of detail in each object. Queries can then follow an approved path and preserve the population being measured instead of rebuilding the join from nearby column names.
Compare and forecast from one metric definition
A metric is more than a label and a formula. Revenue may mean billed revenue or net revenue, use a payment date or booking date, and include or exclude refunds, tests, or particular payment states. Those choices belong in the shared definition.
VAMP ratio is one example of a calculation with several rules about which records count. Once you define it and connect the relevant records, you can compare it across traffic sources, countries, or customer cohorts. Investigate which groups account for a change, using the same calculation for each comparison.
Use that history to train a machine learning model to forecast the metric, with uncertainty shown alongside the estimate. Compare where sources stand today with where they are expected to go. Your team can use those comparisons in an app, monitor them in a dashboard, or ask the AI to investigate them. The same approach applies to conversion rate, revenue per paying customer, and other business metrics.
Data models and machine learning models
The data model describes what the business records mean and how they connect. A machine learning model learns from selected history to estimate an outcome. For example, it may estimate a customer's lifetime value from information available at a defined point in time.
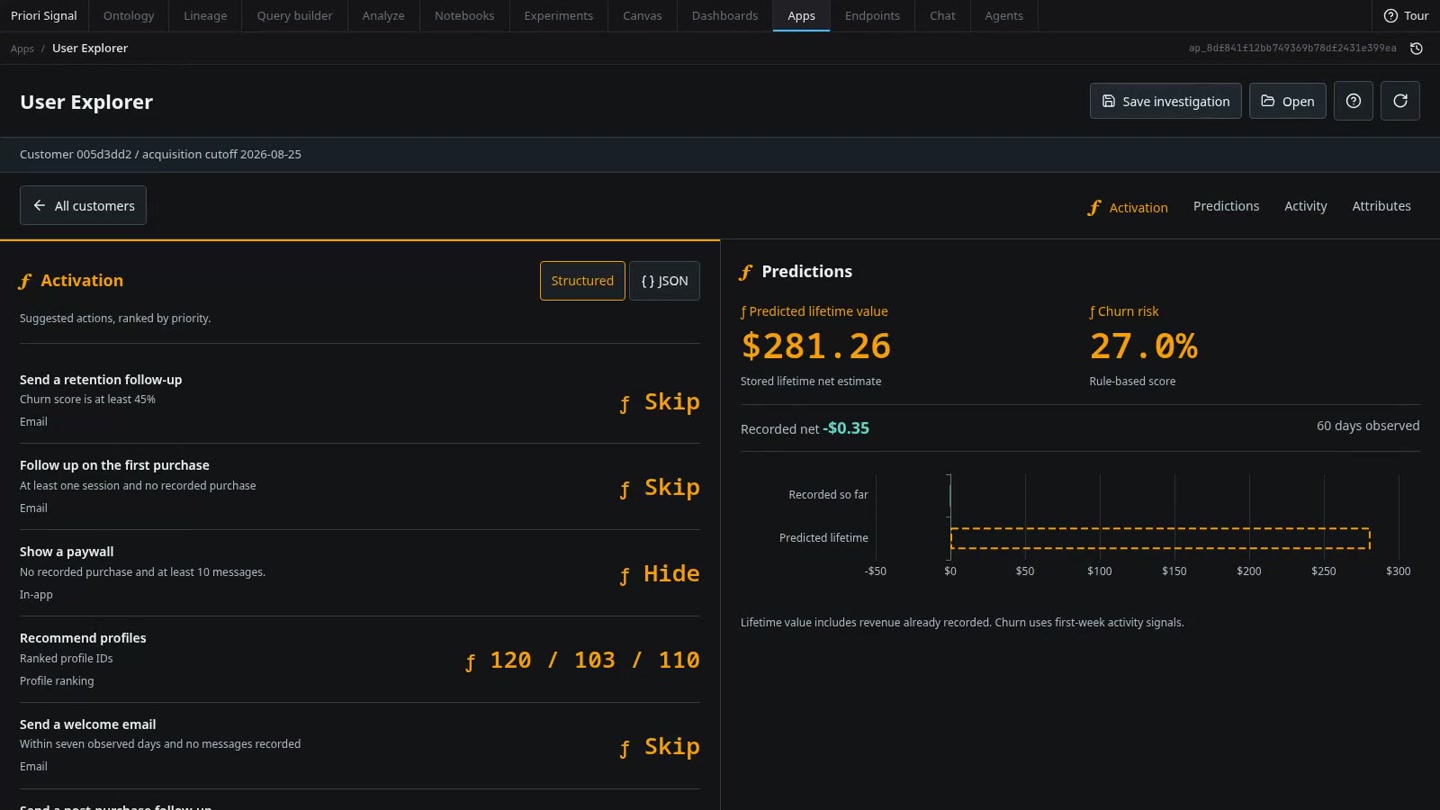
After evaluation, the prediction returns to the shared data model as an output linked to that customer. Recorded revenue and predicted lifetime value remain distinct, but applications can use both without creating a separate customer definition.
Build several tools on one foundation
The path is simple: raw records become a shared data model; machine learning adds predictions; apps, dashboards, BI, APIs, and AI work from both. A new interface does not need to redefine the customer, the source, or net revenue.
This context gives AI analytics approved fields, relationships, and calculations, reducing the information it needs to guess. Important results remain available for review. The same foundation also supports forecasting and flexible custom apps and dashboards.
- Connect the history. Follow a customer from acquisition through activity, payments, and later outcomes.
- Keep definitions shared. Relationships and metrics stay consistent across different interfaces.
- Place predictions in context. Machine learning outputs remain linked to the records and objects they describe.