Home/Intelligence/Custom apps & dashboards
All solutions
Custom apps & dashboards
Build apps and dashboards around your team's work, using your own business data.
Tell AI what your team needs to see, compare, and save. It can build an interface using the records, calculations, and predictions already available in Signal. Your requirements determine the filters, charts, and interactions.
Intelligence
Describe what the app should do
A useful request explains what someone needs to decide and what evidence they need. Name the people using the app, the populations they compare, the measures they trust, and the actions they take afterwards. Describe those needs in ordinary business language.
Example business brief
Build an acquisition review app for our growth team. Compare two traffic sources, or one source with everyone else. Let us filter by date, country, device, and customer activity. Show conversion, revenue, refunds, chargebacks, fees, advertising spend, and return on that spend. Include totals and values per customer so we can compare sources of different sizes. Show error bars when a result is uncertain. Compare sessions, conversations, purchases, and where customers stop using the product. Let us save a review and open it again later.
That leaves room for the interface to fit your work. A finance review, a customer health tool and a source-quality review can use the same data while making different choices about controls, detail and sequence.
An acquisition explorer is one example
This acquisition app follows one team's requirements. Its comparisons, filters, and charts reflect the decisions that team needs to make. Your app can use different measures, controls, and workflows.
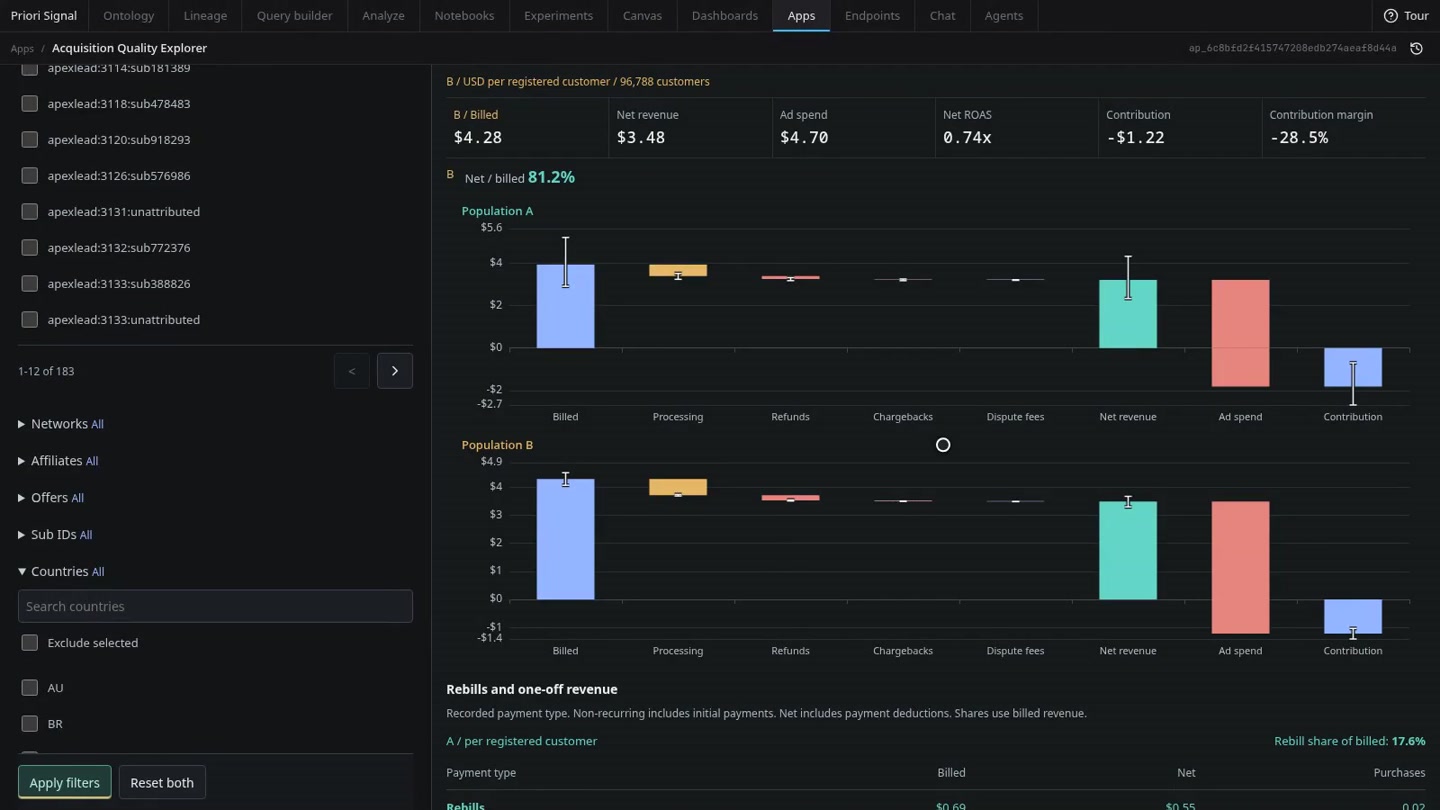
- Compare customer groups. Choose two sources or compare one source with the rest. Filter customer results by date, country, device, and activity. Show when a measure is unavailable for the selection.
- Follow the money per customer. Put billed and net revenue beside processing fees, refunds, chargebacks and advertising cost. Show ROAS, contribution and margin without letting the largest source dominate every view.
- Show the strength of the evidence. Keep customer counts beside rates and amounts. Add uncertainty ranges or error bars so a small population does not look more conclusive than it is.
- Connect behaviour to the outcome. Compare return visits, sessions, conversations, paywall events and time to first purchase. Show where people drop out of the journey before they pay.
- Keep the investigation. Add notes and save the selected filters and comparisons. Reopen the review later with current data.
Use the interface that fits the decision
A dashboard suits a stable set of measures that people monitor. A custom app suits a guided review with specific comparisons, controls, drill-downs or saved work. Use AI analytics when the question is still changing; keep the views that matter, then turn them into a repeatable dashboard or app.
A forecasting workbench is another example. It brings source selection, observed results, predicted outcomes and uncertainty into a focused interface for an acquisition decision.
Change it as the work changes
Ask AI to add a market filter, replace an average with a per-customer measure, simplify a view or create a separate review for another team. Each change can be checked against the real workflow and data before it becomes part of daily work.
- Describe business behaviour. State the decision, comparisons, evidence and follow-up. Leave the implementation to the build process.
- Choose what belongs. Your users, filters, measures, interactions and level of detail shape the app.
- Reuse the foundation. New frontends keep access to the same connected records, calculations and predictions.