Home/Intelligence/BI canvas
All solutions
BI canvas
Work through a question with AI while every useful result stays in view.
Ask AI to create charts and comparisons on an infinite canvas. Keep the earlier results beside each new answer, so you and your team can see how the investigation develops.
Intelligence
A place to investigate
A dashboard is useful when you already know what to monitor. An investigation is different. You may start with a broad question, find an unexpected difference, then need three more views before the pattern makes sense.
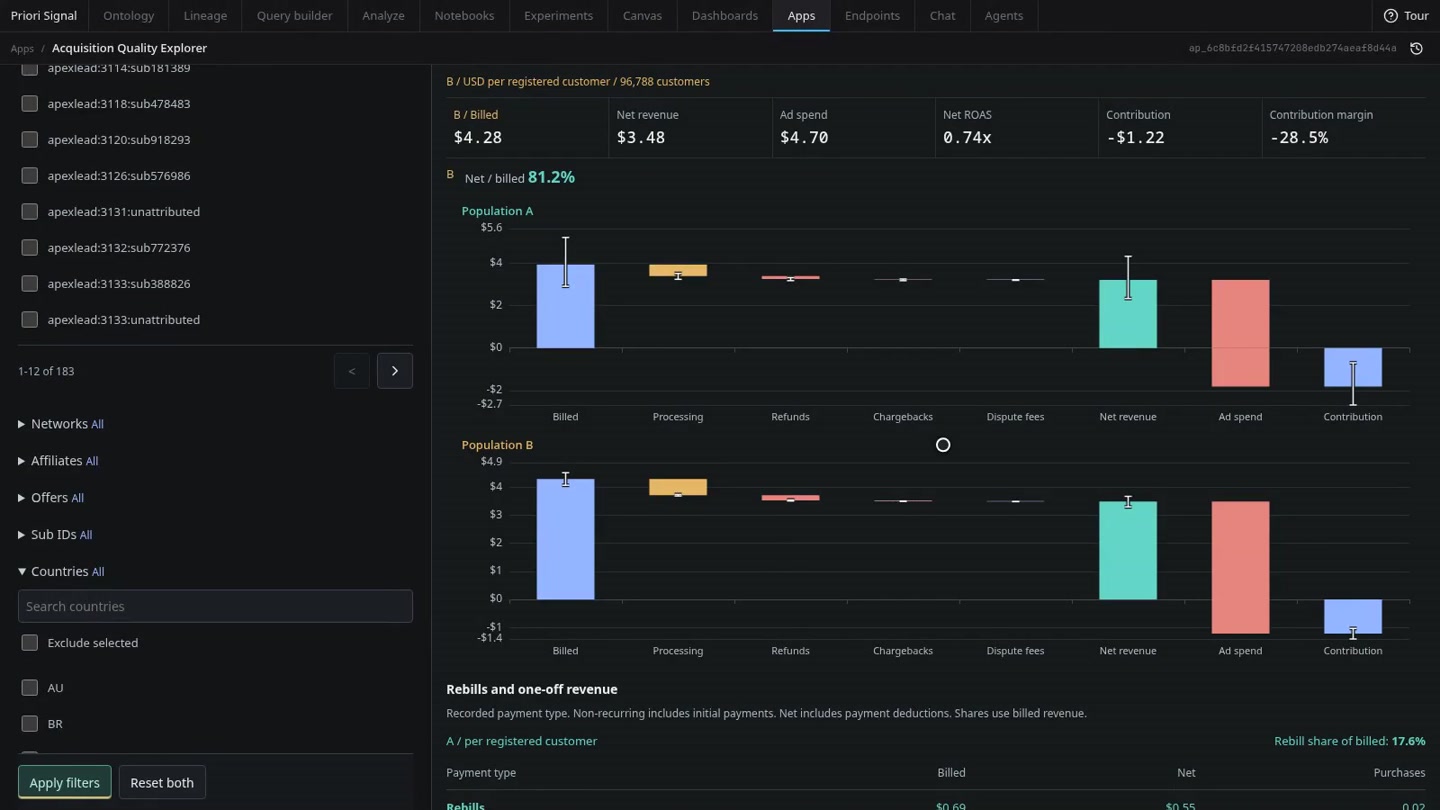
The BI canvas gives that work room. Charts, tables, notes, and AI responses can sit together on one infinite surface. You can zoom out to see the whole line of enquiry or move in to inspect one result. The layout records the path through the problem, rather than presenting a loose collection of charts.
Ask AI for the next comparison
Describe what you want to compare in plain language. The AI builds the visualisation and places it on the canvas. Then ask a follow-up based on what you see. The new result appears beside the earlier one, so context is carried forward without hiding the work that came before.
Compare conversion between networks, examine renewals, or investigate a change in refunds. Ask for the next view as the question develops. The canvas works with the measures available in your data model.
Test a possible explanation
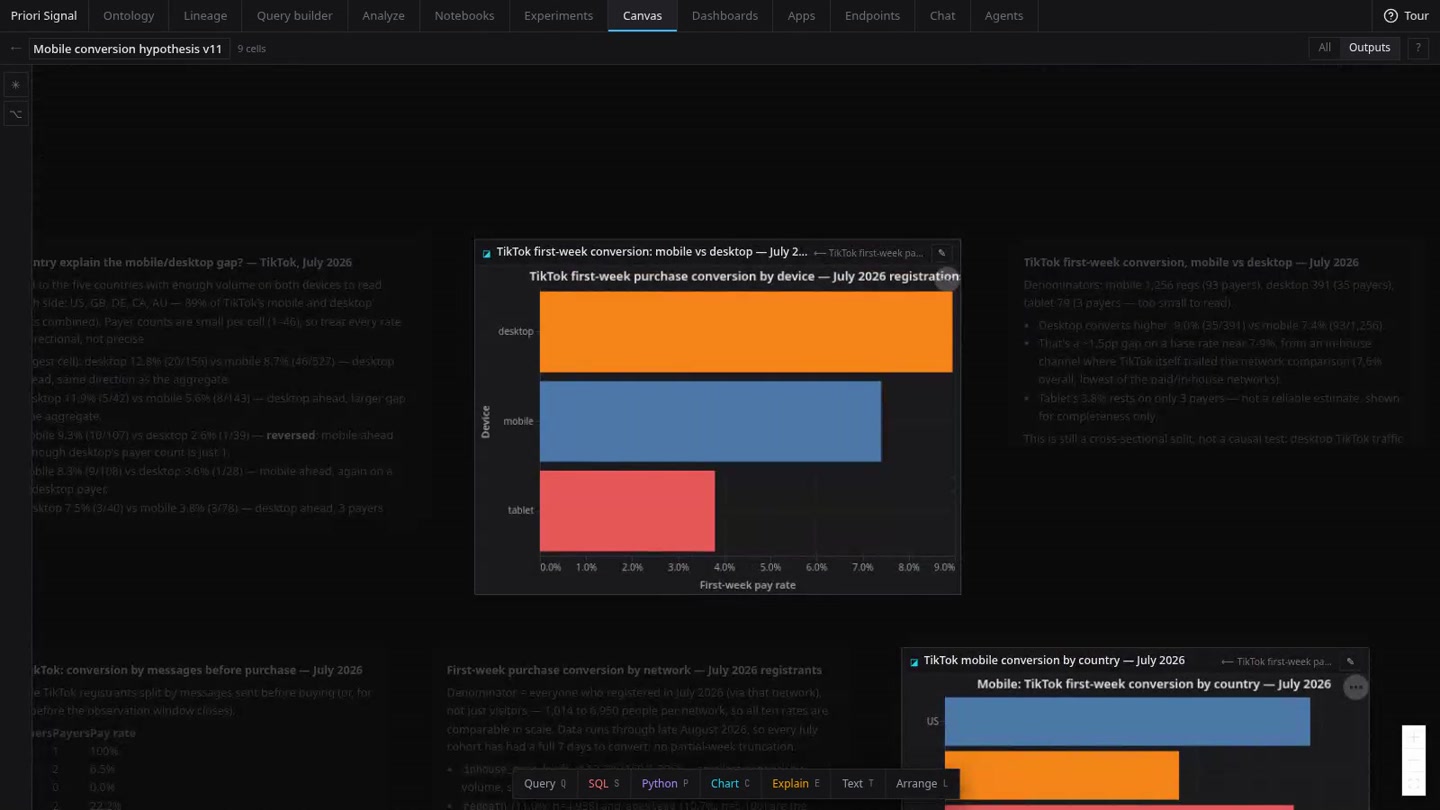
Suppose one source has a lower purchase rate. Could its device mix explain the difference? Ask AI to compare mobile and desktop customers, then put the results beside the original chart. Keep that comparison and test another explanation if needed.
Keep sample sizes, definitions, and caveats near the visuals they qualify. This makes weak evidence easier to spot and helps you separate an interesting difference from a conclusion. A comparison can direct the next question. It does not, by itself, show what caused the difference.
Turn useful work into a tool
Ask AI to turn useful results into a dashboard for regular monitoring. When the work needs its own filters, comparisons, or operating flow, turn it into a custom app. Both can continue to use the same data model as the canvas. For a quick question and follow-ups, start with AI analytics.